


Pandas is an open-source library built on top of NumPy. It allows fast data analysis, data cleaning and preparation. It also has built-in data visualization feature but in this article, we will only look at how to analyze and prepare data for a machine learning model.
Installation
pandas have to be installed, in order to be able to use its features.To install pandas. Install pandas by going to your terminal or command prompt and type
pip install pandasor
conda install pandaswhen working with the anaconda distribution
In this article will be using Jupiter-notebook but you can follow along with any IDE of your choice. The only difference is you have to add a print statement in other to output code
Using Pandas
Pandas just like other python libraries, you first have to import it before you get access to its methods.
import pandas as pdimporting pandas as pd I believe is the community accepted way of importing pandas, you can decide to give it any other alias but pd is the accepted and general way.
Series
Series are just like numpy array object. The difference between numpy array and pandas series is that series can have axis labels. By default every numpy array is an index with positive integers, meanwhile, with series, you decide the label or index you want for your array. Pandas Series can also hold a variety of data. Now let look at the various ways one can create a series.
Using a python list
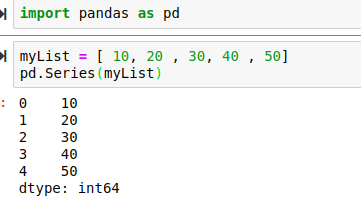
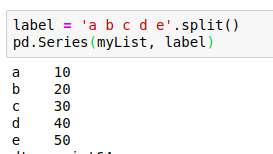
Creating a series from a python list will automatically generate a numerical label(Index) for the series. you can change the label by passing your desired label as a second positional argument.
Using a numpy array
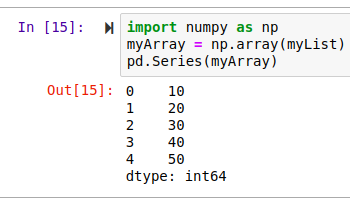
Just like how we created a series from a python list , pass the numpy array as an argument to the series method. First we imported numpy as np. In the second line of code , we created a numpy array from the List we created earlier. If you are not familiar with numpy , you can check out my article on numpy. We then pass the array as an argument to the Series method. NB: An index will be automatically created when not pass as an argument. You can pass any desired index as an argument.
Using a python dictionary

Since a dictionary is a key-value pair data structure, pandas will automatically use the keys of the dictionary as it index and the value of the dictionary as its data. [‘Labaran’, ‘Labs’, ‘Moh’, ‘San’]as you can see used as the index. [10, 20, 30, 40]was used as the data corresponding to the index respectively.
Accessing Data
To access the value of a series, its corresponding index is used just like python list.
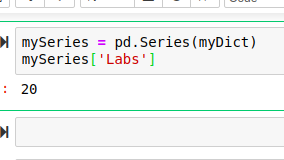
To access the data of a series, we pass it index in a square bracket as seen in the above code. In the above code, we are accessing the value 20 which has an index or label of “Labs”
Arithmetic Operations
All arithmetic operations such as (Addition, subtraction ) are done base on the index of a series.
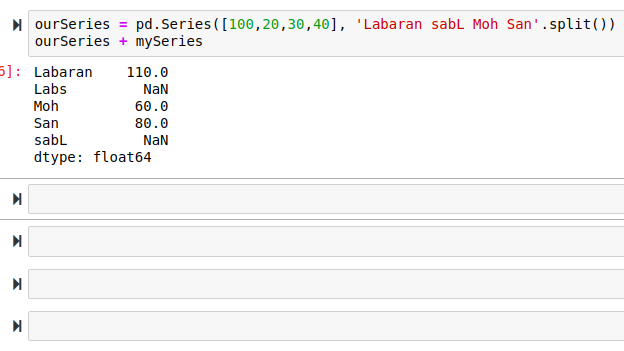
From the above code, we can confirm that arithmetic operations are done base on the index. All values of ourSeries with the corresponding index as mySeries operation was successful. Since Labs of mySeries has no corresponding index to ourSeries , the operation results to NaN ( meaning the number is undefined or unpresentable). Same applies to sabL of ourSeries.
DataFrame
DataFrame is a two-dimensional data Structure (has rows and columns) . We can think of a DataFrame as two or more Series sharing the same index or label. Takes in data, index and columns as an argument. Index and columns are optional arguments, when not provided, pandas will use positive integers or alphabet for them. Now let learn how to create a DataFrame.

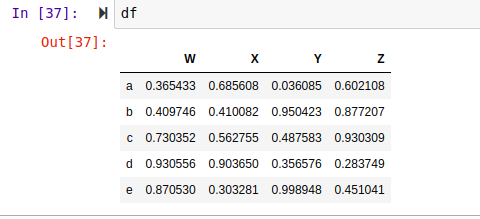
To create a DataFrame, we use the DataFrame method from pandas. In the above code, we generate random numbers with a shape of (5,4) meaning 5 rows, 4 columns. With this, we should have 5 index and 4 columns. We can see the output in the code below.
Accessing Data
Data can be access through columns or rows(either name or index)
Columns

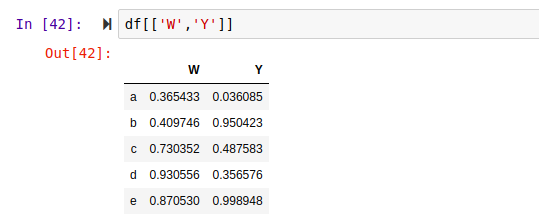
To access a column, pass the column name in a square bracket. This will return a series as you can see above. As I said earlier, DataFrame is a combination of two or more series sharing the same index. one can also pass in a list of columns names to view two or more columns.
Rows
Accessing data in a rows can be done with the loc or iloc method.
let take a look at how it is done.
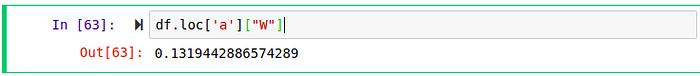
loc
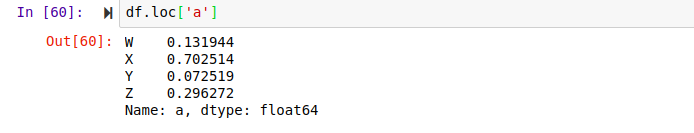
With the loc method you pass in the name of the row , that is the label. In the above code we access all the values in the a row.
iloc
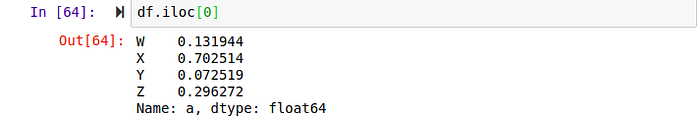
With the iloc , you access based of the position of the label. counting start from 0 . Here in the code above, we access all the values in the first row, which is the row with “a” label.
Adding and Removing columns
To add a new column, you have to pass a column which is not available in the data frame and assign it a value

In the above code , we are adding the values in the “W” and “Y” column and assign the values to a new column called “P”.
NB: If the new column is already in the DataFrame, the values in the column will be overridden.
To remove a column , we use the drop method. The drop method can be used to remove a row or a column.
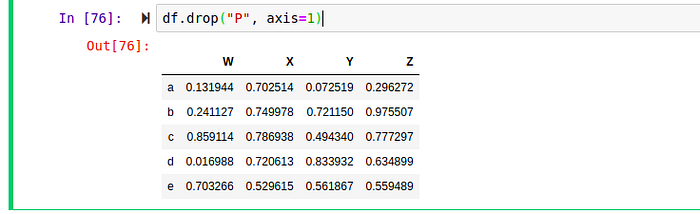
We pass in axis=1 because by default axis is set to 0 which means rows, if we don’t change it to 1 it will result in an error. The axis attribute let us decide whether to drop from the rows(0) or columns(1)
NB: The column won’t be removed from memory. In order to remove the column from memory, we have to pass inplace attribute to True

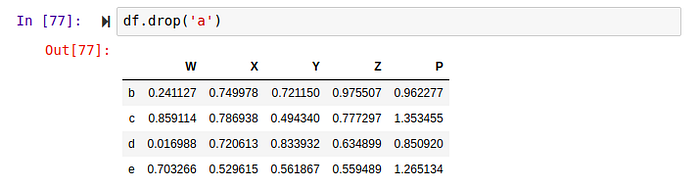
To remove a row we have to pass in the rows name to the drop method. You can decide not to add the axis attribute since by default the axis is set to zero.
Dealing with missing values

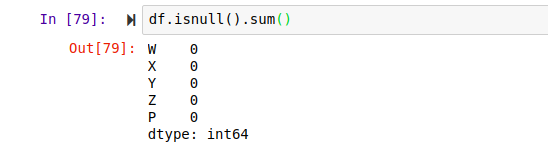
This method returns a Boolean value if an entry in the dataFrame is null. Hint: You can pass the sum() method to check the sum of null values of each column.
dropna
The dropna method is used to drop any columns or rows with null values
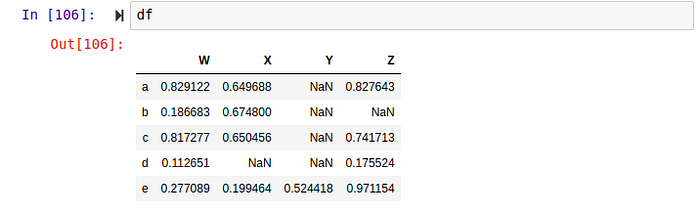
change some values to NaN , you can do same with either the loc or iloc method. Now let look at the dropna method.

By default, the dropna will be applied to rows, since axis=0. In order to apply it on columns, you have to pass axis=1 as an argument.
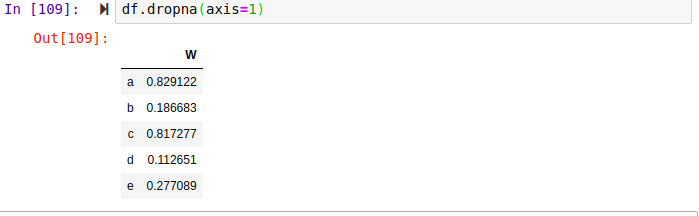
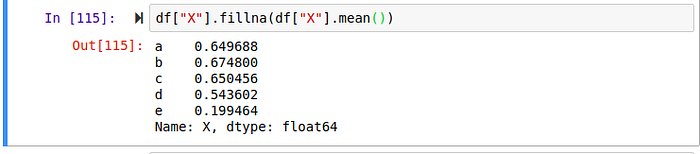
The above code, drops all columns containing null values. Hint: You have to pass the inplace argument in order for it to be applied in memory. fillna The fillna method is used to fill all the missing values with your desired values. You can fill all the missing values with your desired values such as the mean and standard deviation. .
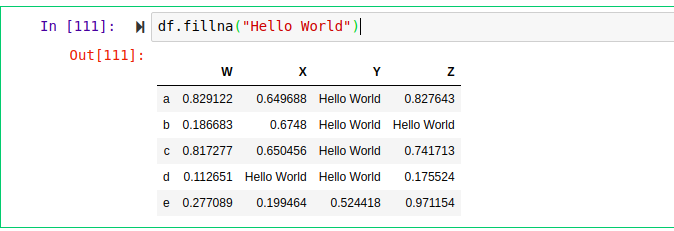
Here we filled all missing values with “Hello World”. You can decide to target a single column, find its mean, and use the mean of that column to fill its’ missing values.
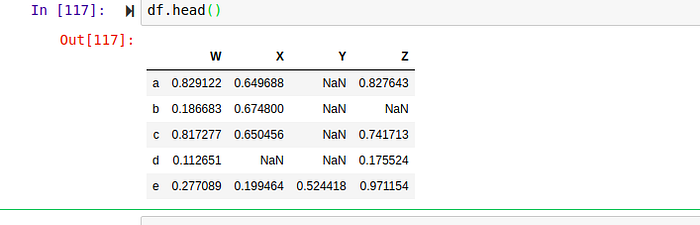
Hint: You have to pass the inplace argument in order for it to be applied in memory. Some useful methods Head The head method print the first 5 rows of the dataFrame .
When you have a large dataset, you can also pass in the number of rows you want the head method to output
df.head(10)
This will output 10 rows from the dataset.
info
The info method prints information about a DataFrame , including the index dtype and column dtype, non-null values;
unique
The `unique method is used to get all unique values
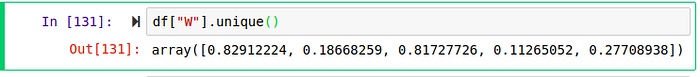
In the above code, we print out all the unique values in the “W” column. nunique This method print the number of unique values every column has.
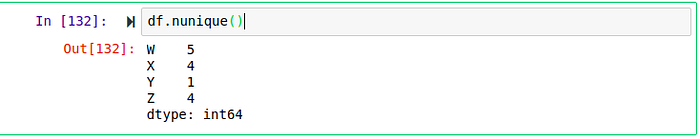
From the above code, we can see column W X Y Z has 5,4,1,4 unique values respectively.
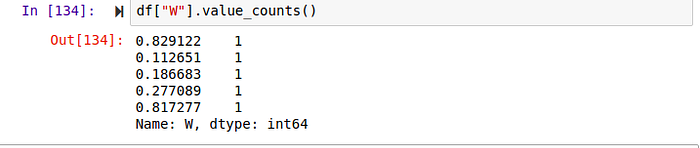
value_counts
This method prints out the number of times the unique values appear
columns
This method prints out all the columns names in the dataset.
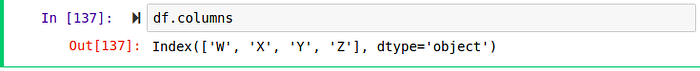
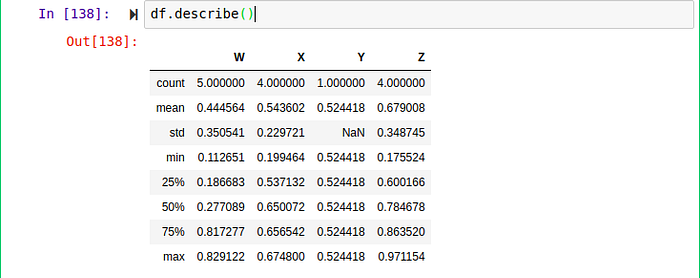
This method is useful when you want to quickly check the columns of a dataset. describe This method outputs descriptive statistics of the dataset such as the mean, standard deviation of every column in the dataset
Data Input and Output Pandas can read a variety of file types, ranging from CSV(comma, separated values) to excel file types. It can even read from your clipboard, most recent item in your clipboard
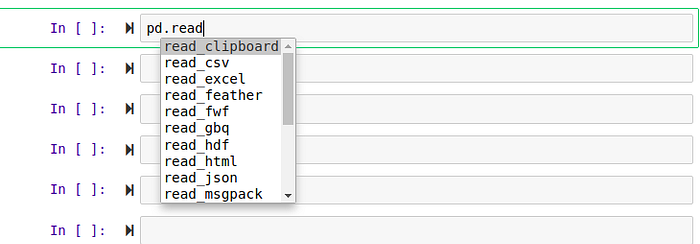
CSV
To read from a CSV file, you pass in the path to the file as an argument to the read_csv method.
Conclusion I believe this covered most of the basics of pandas. You can learn more from their documentation here